Note
Go to the end to download the full example code.
Data from Greenwald et al. (2009)
This example shows how to use the Greenwald et al. (2009) dataset.
[Greenwald2009] investigated the relationship between electrical stimulation amplitude and phosphene brightness in two Argus I users.
Important
You will need to install Pandas
(pip install pandas) for this dataset.
Loading the dataset
The dataset can be loaded as a Pandas DataFrame:
from pulse2percept.datasets import load_greenwald2009
data = load_greenwald2009()
print(data)
   subject implant electrode  ... interphase_dur     pulse_type  threshold
0      S05  ArgusI        B2  ...       0.000975  cathodicfirst     20.688
1      S05  ArgusI        B2  ...       0.000975  cathodicfirst     20.688
2      S05  ArgusI        B2  ...       0.000975  cathodicfirst     20.688
3      S05  ArgusI        B2  ...       0.000975  cathodicfirst     20.688
4      S05  ArgusI        B2  ...       0.000975  cathodicfirst     20.688
..     ...     ...       ...  ...            ...            ...        ...
78     S06  ArgusI        C4  ...       0.000975  cathodicfirst     22.324
79     S06  ArgusI        C4  ...       0.000975  cathodicfirst     22.324
80     S06  ArgusI        C4  ...       0.000975  cathodicfirst     22.324
81     S06  ArgusI        C4  ...       0.000975  cathodicfirst     22.324
82     S06  ArgusI        C4  ...       0.000975  cathodicfirst     22.324

[83 rows x 12 columns]
Inspecting the DataFrame tells us that there are 83 measurements (the rows) each with 12 different attributes (the columns).
These attributes include specifiers such as “subject”, “electrode”, and “task”. We can print all column names using:
print(data.columns)
Index(['subject', 'implant', 'electrode', 'task', 'stim_class', 'stim_dur',
       'amp', 'brightness', 'pulse_dur', 'interphase_dur', 'pulse_type',
       'threshold'],
      dtype='object')
Note
The meaning of all column names is explained in the docstring of
the load_greenwald2009() function.
For example, “amp” corresponds to the amplitude of the stimulation used in a particular measurement:
data.amp.unique()
array([ 41.328, 29.805, 52.714, ..., 316.007, 385.932, 248.806])
To select all the rows where the same subject was used, such as ‘S05’ we can index into the DataFrame as follows:
print(data[data.subject == 'S05'])
   subject implant electrode  ... interphase_dur     pulse_type  threshold
0      S05  ArgusI        B2  ...       0.000975  cathodicfirst     20.688
1      S05  ArgusI        B2  ...       0.000975  cathodicfirst     20.688
2      S05  ArgusI        B2  ...       0.000975  cathodicfirst     20.688
3      S05  ArgusI        B2  ...       0.000975  cathodicfirst     20.688
4      S05  ArgusI        B2  ...       0.000975  cathodicfirst     20.688
5      S05  ArgusI        B2  ...       0.000975  cathodicfirst     20.688
6      S05  ArgusI        B2  ...       0.000975  cathodicfirst     20.688
7      S05  ArgusI        B2  ...       0.000975  cathodicfirst     20.688
8      S05  ArgusI        B2  ...       0.000975  cathodicfirst     20.688
9      S05  ArgusI        B2  ...       0.000975  cathodicfirst     20.688
10     S05  ArgusI        B2  ...       0.000975  cathodicfirst     20.688
11     S05  ArgusI        B2  ...       0.000975  cathodicfirst     20.688
12     S05  ArgusI        B2  ...       0.000975  cathodicfirst     20.688
13     S05  ArgusI        B2  ...       0.000975  cathodicfirst     20.688
14     S05  ArgusI        B2  ...       0.000975  cathodicfirst     20.688
15     S05  ArgusI        B2  ...       0.000975  cathodicfirst     20.688
16     S05  ArgusI        B2  ...       0.000975  cathodicfirst     20.688
17     S05  ArgusI        B2  ...       0.000975  cathodicfirst     20.688
18     S05  ArgusI        B2  ...       0.000975  cathodicfirst     20.688
19     S05  ArgusI        B2  ...       0.000975  cathodicfirst     20.688
20     S05  ArgusI        B2  ...       0.000975  cathodicfirst     20.688
21     S05  ArgusI        B2  ...       0.000975  cathodicfirst     20.688
33     S05  ArgusI        C3  ...       0.000975  cathodicfirst     35.408
34     S05  ArgusI        C3  ...       0.000975  cathodicfirst     35.408
35     S05  ArgusI        C3  ...       0.000975  cathodicfirst     35.408
36     S05  ArgusI        C3  ...       0.000975  cathodicfirst     35.408
37     S05  ArgusI        C3  ...       0.000975  cathodicfirst     35.408
38     S05  ArgusI        C3  ...       0.000975  cathodicfirst     35.408
39     S05  ArgusI        C3  ...       0.000975  cathodicfirst     35.408
40     S05  ArgusI        C3  ...       0.000975  cathodicfirst     35.408
41     S05  ArgusI        C3  ...       0.000975  cathodicfirst     35.408
42     S05  ArgusI        C3  ...       0.000975  cathodicfirst     35.408
43     S05  ArgusI        C3  ...       0.000975  cathodicfirst     35.408
44     S05  ArgusI        C3  ...       0.000975  cathodicfirst     35.408
45     S05  ArgusI        C3  ...       0.000975  cathodicfirst     35.408
46     S05  ArgusI        C3  ...       0.000975  cathodicfirst     35.408
56     S05  ArgusI        C4  ...       0.000975  cathodicfirst     24.000
57     S05  ArgusI        C4  ...       0.000975  cathodicfirst     24.000
58     S05  ArgusI        C4  ...       0.000975  cathodicfirst     24.000
59     S05  ArgusI        C4  ...       0.000975  cathodicfirst     24.000
60     S05  ArgusI        C4  ...       0.000975  cathodicfirst     24.000
61     S05  ArgusI        C4  ...       0.000975  cathodicfirst     24.000
62     S05  ArgusI        C4  ...       0.000975  cathodicfirst     24.000
63     S05  ArgusI        C4  ...       0.000975  cathodicfirst     24.000
64     S05  ArgusI        C4  ...       0.000975  cathodicfirst     24.000
65     S05  ArgusI        C4  ...       0.000975  cathodicfirst     24.000
66     S05  ArgusI        C4  ...       0.000975  cathodicfirst     24.000
67     S05  ArgusI        C4  ...       0.000975  cathodicfirst     24.000

[48 rows x 12 columns]
Likewise, we can perform the same operation when initially loading the data as follows:
print(load_greenwald2009(subjects='S05'))
   subject implant electrode  ... interphase_dur     pulse_type  threshold
0      S05  ArgusI        B2  ...       0.000975  cathodicfirst     20.688
1      S05  ArgusI        B2  ...       0.000975  cathodicfirst     20.688
2      S05  ArgusI        B2  ...       0.000975  cathodicfirst     20.688
3      S05  ArgusI        B2  ...       0.000975  cathodicfirst     20.688
4      S05  ArgusI        B2  ...       0.000975  cathodicfirst     20.688
5      S05  ArgusI        B2  ...       0.000975  cathodicfirst     20.688
6      S05  ArgusI        B2  ...       0.000975  cathodicfirst     20.688
7      S05  ArgusI        B2  ...       0.000975  cathodicfirst     20.688
8      S05  ArgusI        B2  ...       0.000975  cathodicfirst     20.688
9      S05  ArgusI        B2  ...       0.000975  cathodicfirst     20.688
10     S05  ArgusI        B2  ...       0.000975  cathodicfirst     20.688
11     S05  ArgusI        B2  ...       0.000975  cathodicfirst     20.688
12     S05  ArgusI        B2  ...       0.000975  cathodicfirst     20.688
13     S05  ArgusI        B2  ...       0.000975  cathodicfirst     20.688
14     S05  ArgusI        B2  ...       0.000975  cathodicfirst     20.688
15     S05  ArgusI        B2  ...       0.000975  cathodicfirst     20.688
16     S05  ArgusI        B2  ...       0.000975  cathodicfirst     20.688
17     S05  ArgusI        B2  ...       0.000975  cathodicfirst     20.688
18     S05  ArgusI        B2  ...       0.000975  cathodicfirst     20.688
19     S05  ArgusI        B2  ...       0.000975  cathodicfirst     20.688
20     S05  ArgusI        B2  ...       0.000975  cathodicfirst     20.688
21     S05  ArgusI        B2  ...       0.000975  cathodicfirst     20.688
22     S05  ArgusI        C3  ...       0.000975  cathodicfirst     35.408
23     S05  ArgusI        C3  ...       0.000975  cathodicfirst     35.408
24     S05  ArgusI        C3  ...       0.000975  cathodicfirst     35.408
25     S05  ArgusI        C3  ...       0.000975  cathodicfirst     35.408
26     S05  ArgusI        C3  ...       0.000975  cathodicfirst     35.408
27     S05  ArgusI        C3  ...       0.000975  cathodicfirst     35.408
28     S05  ArgusI        C3  ...       0.000975  cathodicfirst     35.408
29     S05  ArgusI        C3  ...       0.000975  cathodicfirst     35.408
30     S05  ArgusI        C3  ...       0.000975  cathodicfirst     35.408
31     S05  ArgusI        C3  ...       0.000975  cathodicfirst     35.408
32     S05  ArgusI        C3  ...       0.000975  cathodicfirst     35.408
33     S05  ArgusI        C3  ...       0.000975  cathodicfirst     35.408
34     S05  ArgusI        C3  ...       0.000975  cathodicfirst     35.408
35     S05  ArgusI        C3  ...       0.000975  cathodicfirst     35.408
36     S05  ArgusI        C4  ...       0.000975  cathodicfirst     24.000
37     S05  ArgusI        C4  ...       0.000975  cathodicfirst     24.000
38     S05  ArgusI        C4  ...       0.000975  cathodicfirst     24.000
39     S05  ArgusI        C4  ...       0.000975  cathodicfirst     24.000
40     S05  ArgusI        C4  ...       0.000975  cathodicfirst     24.000
41     S05  ArgusI        C4  ...       0.000975  cathodicfirst     24.000
42     S05  ArgusI        C4  ...       0.000975  cathodicfirst     24.000
43     S05  ArgusI        C4  ...       0.000975  cathodicfirst     24.000
44     S05  ArgusI        C4  ...       0.000975  cathodicfirst     24.000
45     S05  ArgusI        C4  ...       0.000975  cathodicfirst     24.000
46     S05  ArgusI        C4  ...       0.000975  cathodicfirst     24.000
47     S05  ArgusI        C4  ...       0.000975  cathodicfirst     24.000

[48 rows x 12 columns]
Note
Please see the documentation for load_greenwald2009()
to see all available parameters for data subset loading.
Plotting the data
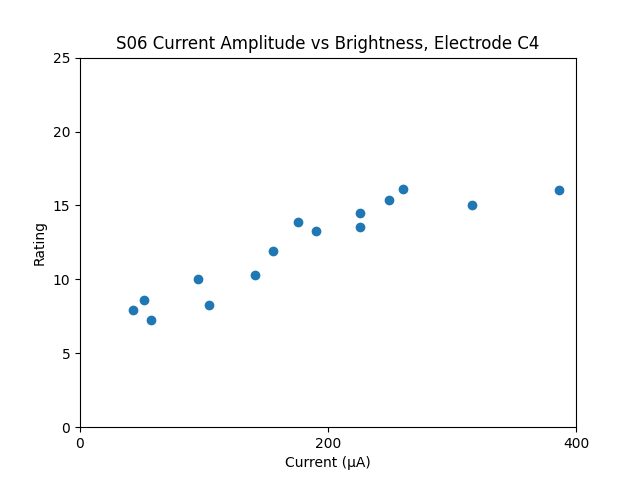
To see the relationship between electrical stimulation amplitude and phosphene brightness, let us demonstrate partially recreating part of Figure 2 from the paper. Specifically, we will look at subject S06 and electrode C4. Please note, we omit the power fits in this demonstration.
import matplotlib.pyplot as plt
data = load_greenwald2009(subjects='S06', electrodes='C4')

# Adjust the x-axis scaling, and add title
plt.xlim(0, 400)
plt.xticks(ticks=[0, 200, 400])
plt.xlabel("Current (µA)")

# Adjust the y-axis scaling, and add title
plt.ylabel("Rating")

plt.title("S06")
plt.ylim(0, 25)

# Add figure title
plt.title("S06 Current Amplitude vs Brightness, Electrode C4")

# Plot the data
plt.scatter(data.amp, data.brightness)
plt.show()
Total running time of the script: (0 minutes 0.066 seconds)