Note
Go to the end to download the full example code.
Generating a sinusoidal pulse train
This example shows how to build a sinusoidal pulse train from scratch.
In addition to built-in stimuli such as
BiphasicPulse and
BiphasicPulseTrain, you can also create your
own Stimulus by manually specifying the
values for the data container and time axis.
Consider a sine wave:
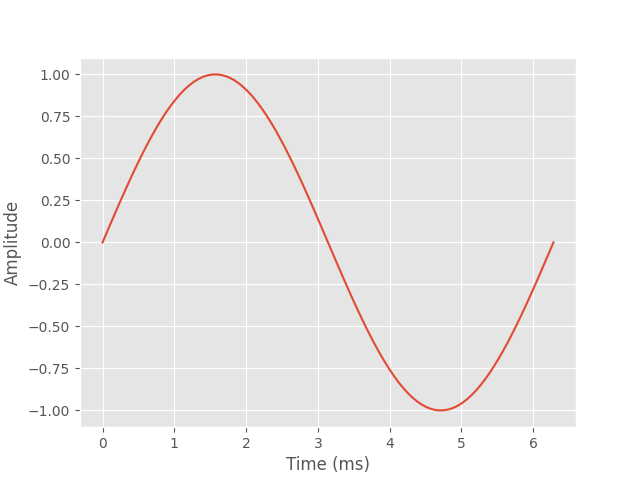
Text(22.347222222222214, 0.5, 'Amplitude')
To turn this sine wave into a stimulus feasible for a retinal implant, it will have to be discretized to a number of different amplitude levels.
The following code turns the sine wave into 5 different amplitude levels:
levels = np.linspace(-1, 1, num=5)
data = levels[np.argmin(np.abs(x[:, np.newaxis] - levels), axis=1)]

plt.plot(t, data, label='discretized')
plt.plot(t, x, label='original')
plt.xlabel('Time (ms)')
plt.ylabel('Amplitude')
plt.legend()
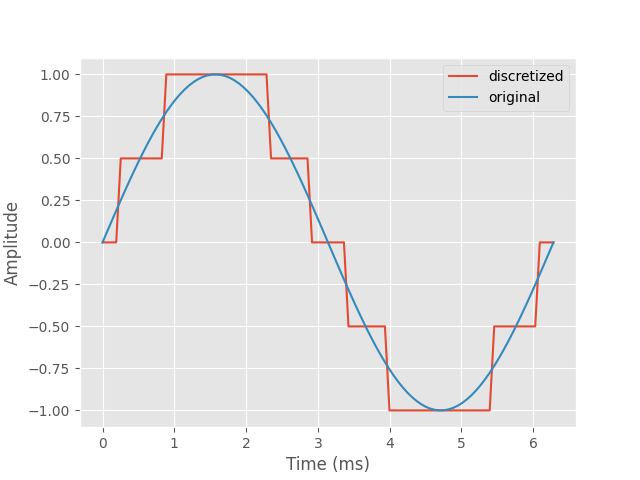
<matplotlib.legend.Legend object at 0x7519707d2690>
We can turn this signal into a Stimulus
object as follows:
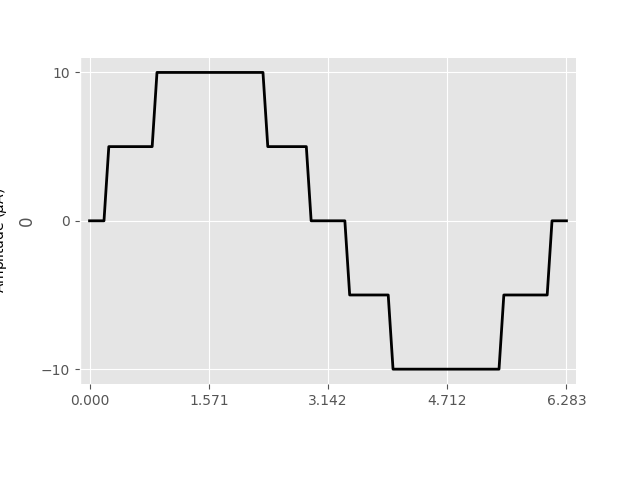
<Axes: ylabel='0'>
Alternatively, we can automate this process by creating a new class
SinusoidalPulse that inherits from Stimulus:
class SinusoidalPulse(Stimulus):

    def __init__(self, amp, freq, phase, stim_dur, n_levels=5, dt=DT):
        """Sinusoidal pulse

        Parameters
        ----------
        amp : float
            Maximum stimulus amplitude (uA)
        freq : float
            Ordinary frequency of the sine wave (Hz)
        phase : float
            Phase of the sine wave (rad)
        stim_dur : float
            Stimulus duration (ms)
        n_levels : int, optional, default: 5
            Number of discretization levels
        dt : float, optional, default: 0.001
            Smallest time step (ms)
        """
        # Create the sine wave:
        t = np.arange(0, stim_dur + dt / 2, dt)
        x = np.sin(2 * np.pi * freq * t + phase)
        # Discretize it:
        levels = np.linspace(-1, 1, num=n_levels)
        data = levels[np.argmin(np.abs(x[:, np.newaxis] - levels), axis=1)]
        # Reshape data to 1xM so it is interpreted as M data points for a
        # single electrode:
        data = amp * data.reshape((1, -1))
        # Call the Stimulus constructor:
        super(SinusoidalPulse, self).__init__(data, time=t, compress=True)
Then we can create a new pulse as follows:
sine = SinusoidalPulse(26, 0.25, -np.pi / 4, 20)
sine.plot()
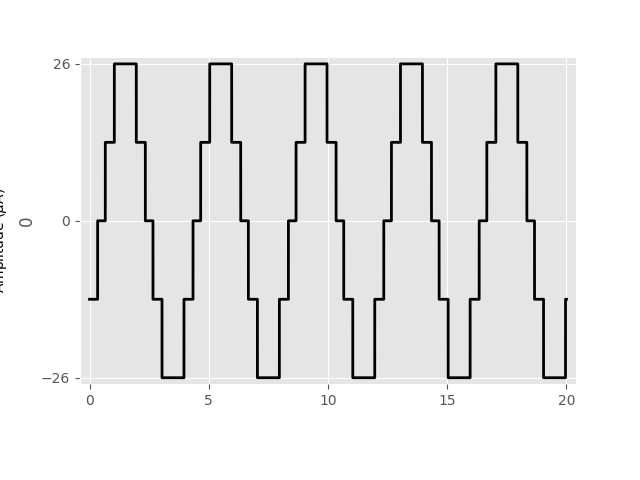
<Axes: ylabel='0'>
Total running time of the script: (0 minutes 0.148 seconds)